\[ \newcommand{\pr}{\mathbb{P}}\newcommand{\E}{\mathbb{E}} \] Relative risks (and risk differences) are collapsible and generally considered easier to interpret than odds-ratios. In a recent publication Richardson et al (JASA, 2017) proposed a new regression model for a binary exposure which solves the computational problems that are associated with using for example binomial regression with a log-link function (or identify link for the risk difference) to obtain such parameter estimates.
Let \(Y\) be the binary response, \(A\) binary exposure, and \(V\) a vector of covariates, then the target parameter is
\begin{align*} &\mathrm{RR}(v) = \frac{\pr(Y=1\mid A=1, V=v)}{\pr(Y=1\mid A=0, V=v)}. \end{align*}
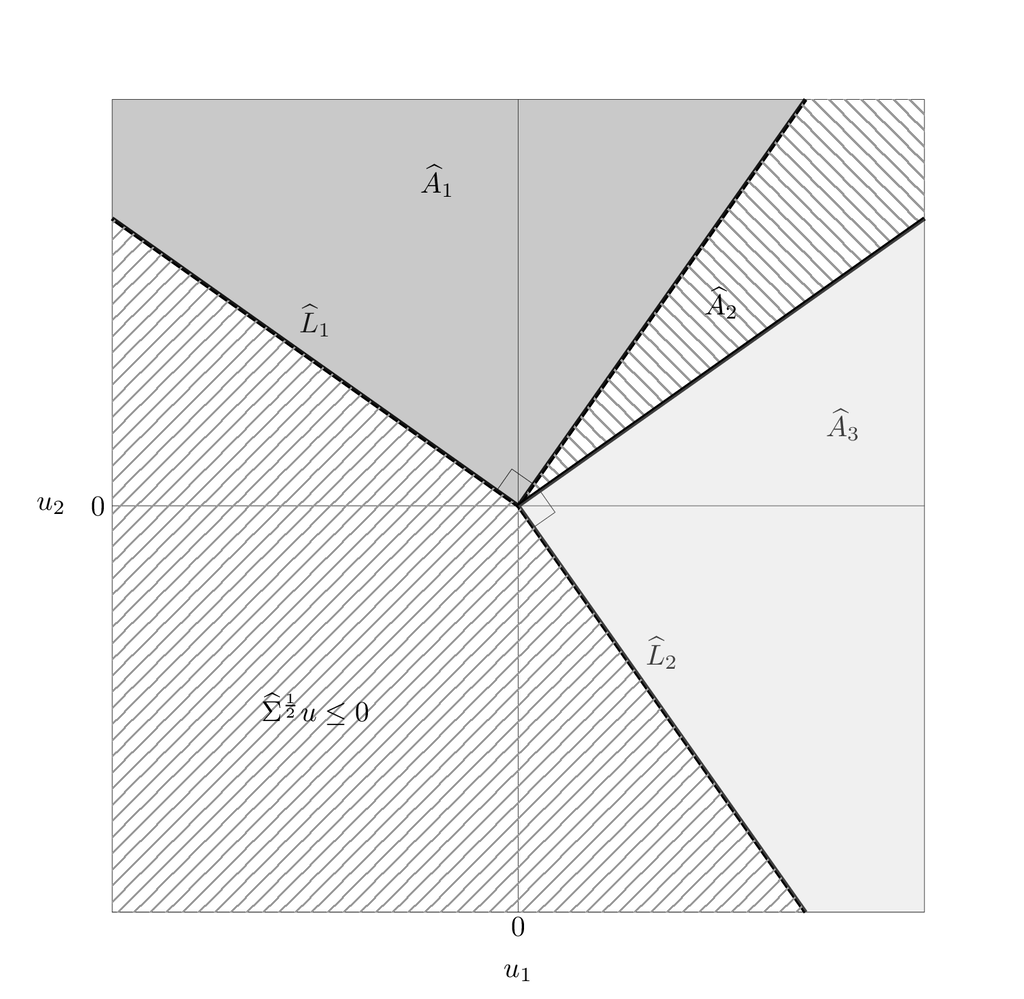
Let \(p_a(V) = \pr(Y \mid A=a, V), a\in\{0,1\}\), the idea is then to posit a linear model for \[ \theta(v) = \log \big(RR(v)\big) \] and a nuisance model for the odds-product \[ \phi(v) = \log\left(\frac{p_{0}(v)p_{1}(v)}{(1-p_{0}(v))(1-p_{1}(v))}\right) \] noting that these two parameters are variation independent which can be from the below L’Abbé plot. Similarly, a model can be constructed for the risk-difference on the following scale \[\theta(v) = \mathrm{arctanh} \big(RD(v)\big).\]
...